
Volatility is All You Need
Venture is the opposite of Warren Buffet - it's moneyprinters all the way down - kurtosis (bonds), kurtosis (equities), and kurtosis (soybean futures) - a venture-puts long straddle trade

“The world is changed. I feel it in the water. I feel it in the earth. I smell it in the air. Much that once was is lost, for none now live who remember it.” Lord of the Rings, The Fellowship of the Ring, 2001

The great fortunes have all been made in chaos.
Rockefeller, Carnegie, Vanderbilt - the railroad-scale production of the robber barons made them money hand over fist, boot over neck, anything to capitalise the regime shift. The Medici financed emerging powers; the Welsers bet on conquistadors; Trump rode the wild rise of New York real estate, and Slim and Dangote feudalised their emerging markets. Most of the Forbes 500 didn’t squirrel their way to wealth over the course of a prudent and stuffy lifetime. Having done so is one of the things that makes Buffet so rare.
There’s a punchy take that the Musks of the world are created not by - as say, your run-of-the-mill Ivy League parents, are - a compounding of good decisions, but rather by a series of going all in on black, every time. More technically: “you get to the tail by increasing the variance (or the scale) rather than raising the expectation”.
Seeking fortune, you’re more likely to find it in extreme environments. This argument was core to If Nassim Taleb were a VC: venture should unabashedly go after the most right tail things. A high loss ratio is a feature. Most companies, funds, and vintages are bust, some are milli-baggers. It’s the exact opposite of Buffet being perfectly willing to trade away a big payoff for a certain payoff.
I’m arguing here that things are going to get a lot more extreme (they have been doing so for a while) and that venture benefits disproportionately from this extremity. My hope is to get you to go “oh shucks, that’s cool, it actually shows up in the data” and then “wait, but what has this got to do with venture?”.
“Oh shucks, that’s cool, it actually shows up in the data”
There’re a bunch of stats outside the markets that show some kind of extremity, like the number of state based armed conflicts nearly tripling since the 60’s, or global freight ships experiencing nearly 19x more delays they did in 2016. But these are pinpricks of colour, the markets are mirrors. If the world is getting more extreme, our collective, implied view of it - our revealed forecasting - would’ve begun to reflect that.
Look at a chart of the VIX (the index measuring the volatility of the S&P500). You’ll notice it’s pretty stable with some spikes around the GFC and COVID. What we’re interested in is not “is the VIX increasing over time” but rather “are the spikes of the VIX getting bigger, and more frequent”. When you fatten the tails in a distribution, you decrease the frequency of small-scale volatility and increase the outliers. The term we use for measuring this fatness is kurtosis. Looking at the kurtosis of SPY’s price action over an annualised window, you’ll see a small and steady increase since 2007.
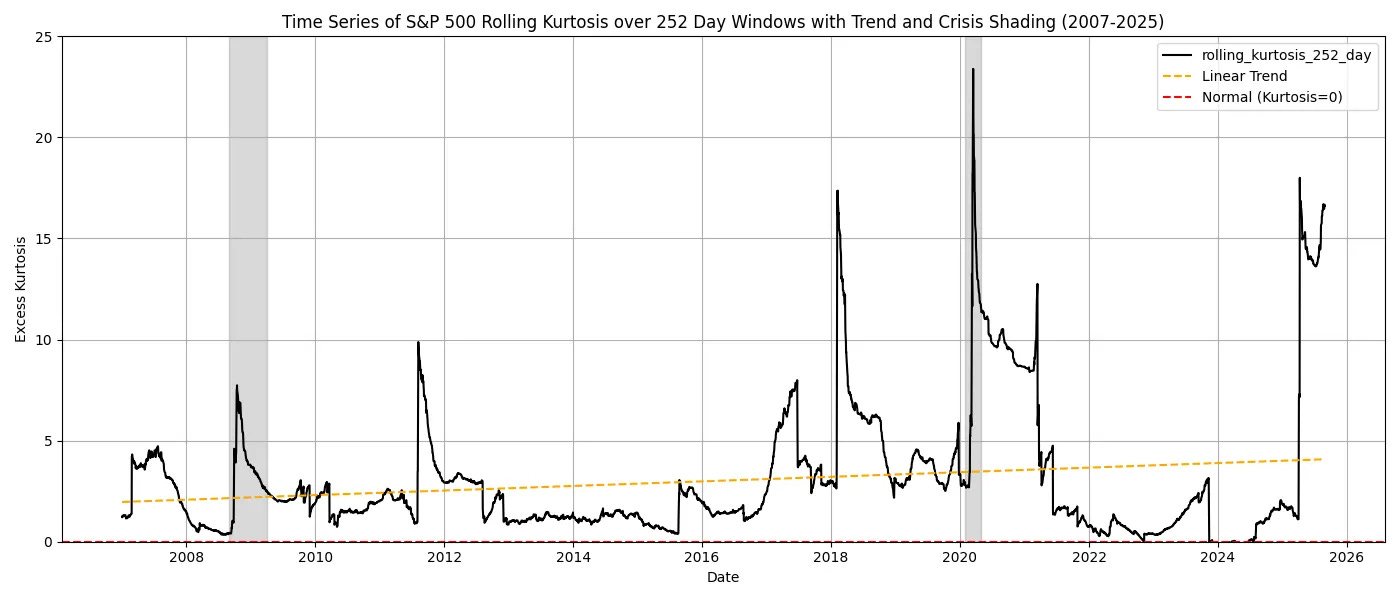
For most of these charts the trend line, while upward, is fairly weak. I’ve tried to give two decades worth of trend in most cases and I’m not making a statistical case here.1
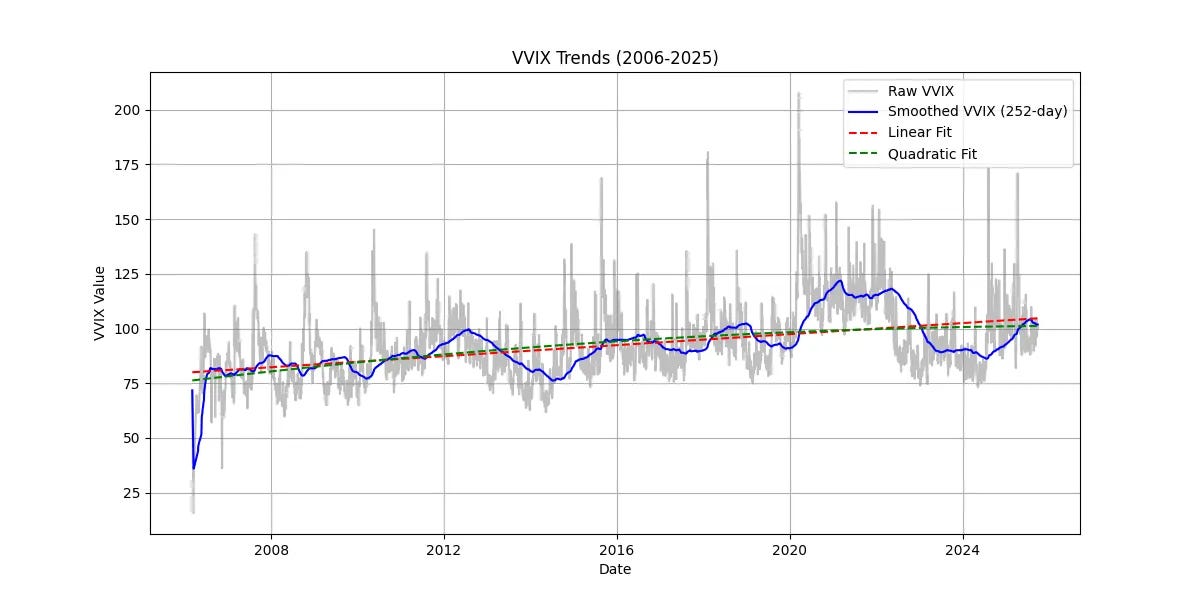
We’re interested not in how volatile the index is, but how volatile it’s volatility (vol-of-vol) is. Vol-of-vol is not quite the same as kurtosis, but it’s a good enough proxy for us. The index for this - the VVIX - has data from 2006 onwards. Looking at the VVIX, there’s a bunch of noise but again we’ve got a small uptrend over the same timeframe.2
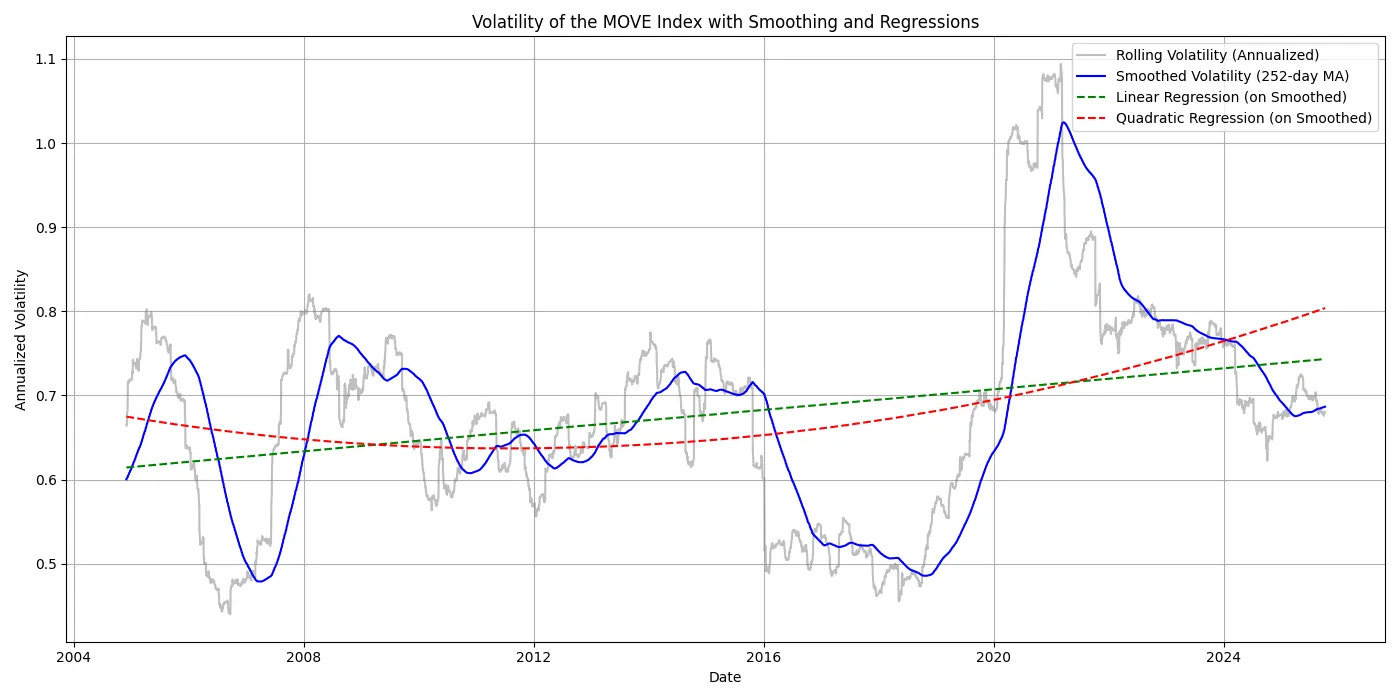
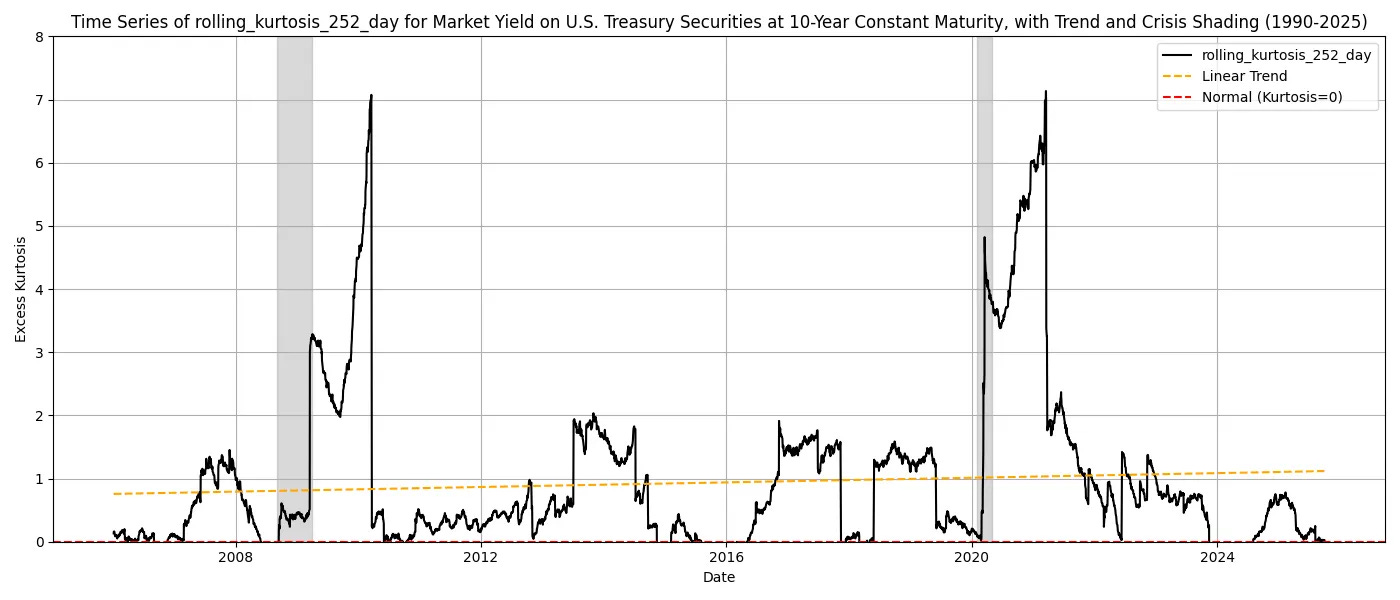
If we’re right, we should see a similar trend in bond kurtosis. Looking at both the volatility of the MOVE Index, like the VIX for a range of treasury maturities, and the kurtosis for the 10-year one, there’s a similar uptrend.
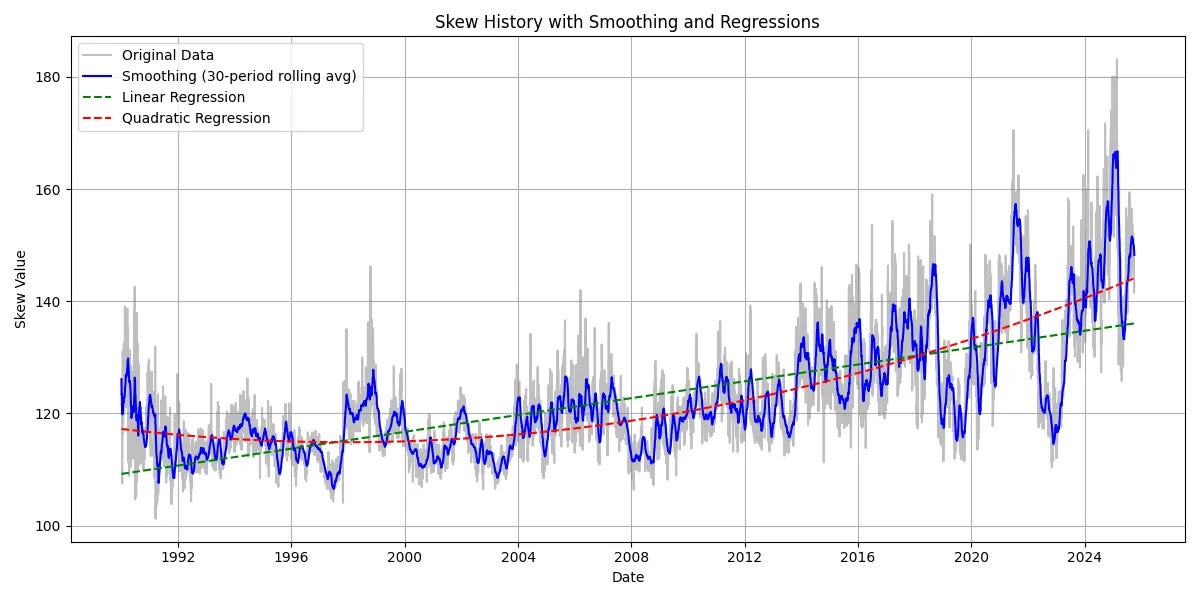
The most blatant area this extremity shows up is the SKEW index which measures the market expectations for ‘tail risk’ using the implied volatility of out-of-the-money (OTM) strikes for the S&P 500.
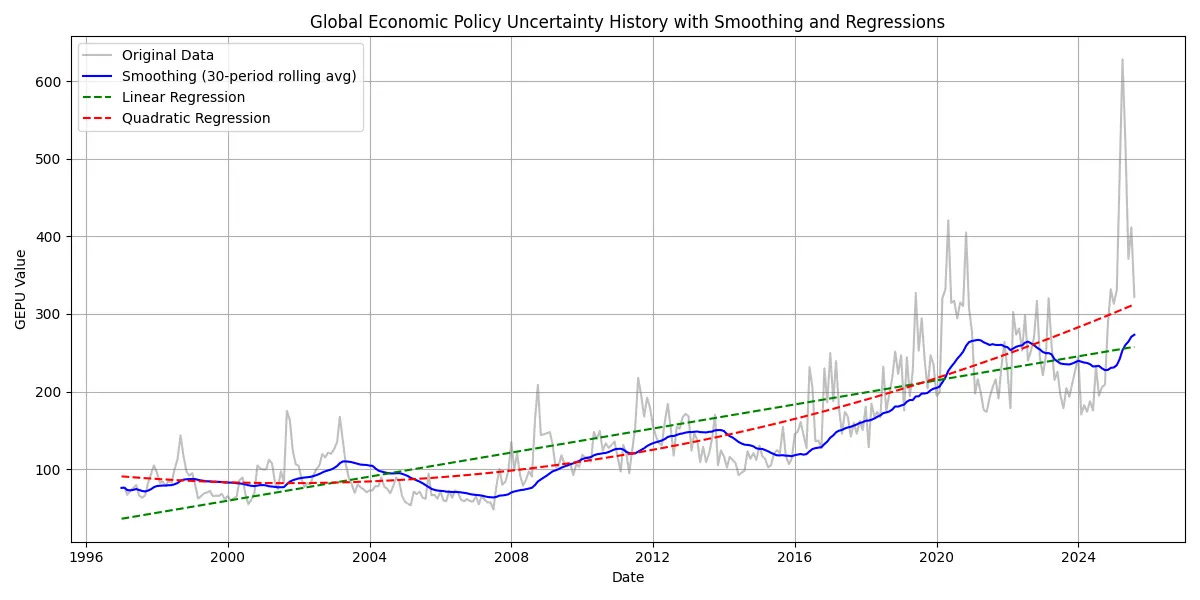
Global policy also seems chaotic. Biden’s asset freezes and Trump’s tariffs - you only have to look at the price action of gold as central banks increase reserves at the expense of USD to see the erosion of trust. The most widely accepted measure of global policy uncertainty is a GDP-weighted average of national EPU indices for 20 countries put together by a couple Stanford profs. Graphing this out, it seems not only increasingly uncertain, but increasing in an increasing way.
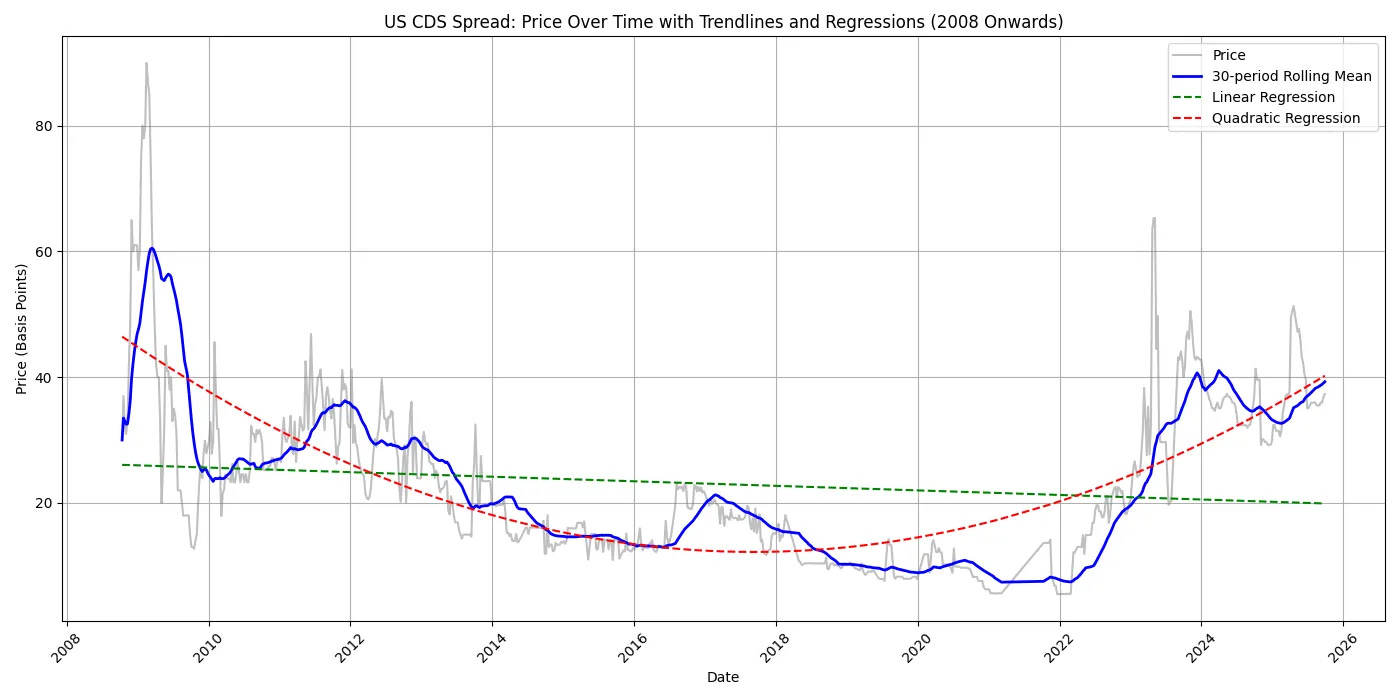
One way to hedge credit risk (made famous by The Big Short) are credit default swaps, which pay out when people default on their debt. Like the SKEW index, the US 5 Year CDS spreads (the cost of insuring against the US defaulting) has been steadily rising over the last decade. Given how bad it would be for the global bond market if the US were to default, this can be seen as a bond-market proxy for the kind of extreme price action that SKEW captures in equities.3 Notice how we’ve been steadily approaching 2008 levels since 2022.
“Nice graphs bro, pls explain?”
I’ve used uncertainty, extremity, vol-of-vol, or kurtosis interchangeably but really what the graphs above are meant to show is that, according to our magic market mirrors, we should all expect more big price movements in the future. Asking why is moving into speculation. So speculating here, with the help of some Econ 101 courses:
We’ve taken out lots of debt and kept interest rates low for a very long time.4 Collectively, we’ve moved so far out on the risk curve in search of yield that investors with payout minimums (pensions, endowments) are forced to take on greater and greater volatility. We’re collectively leveraged and there’s more appetite now for fringe stuff.
We’re hyper-globalised. We know large, dense, networked systems have increasing cascade potential both negative (like when the Ever Given got stuck sideways in the Suez Canal and we nearly created another toilet paper shortage) and positive (we were able to distribute the COVID-19 vaccine at ridiculous speed). As we increase network size, we get more innovation and more potential for dysfunction.5
We’re hyper-financialised. Two major changes to our market structures have been taking place simultaneously.
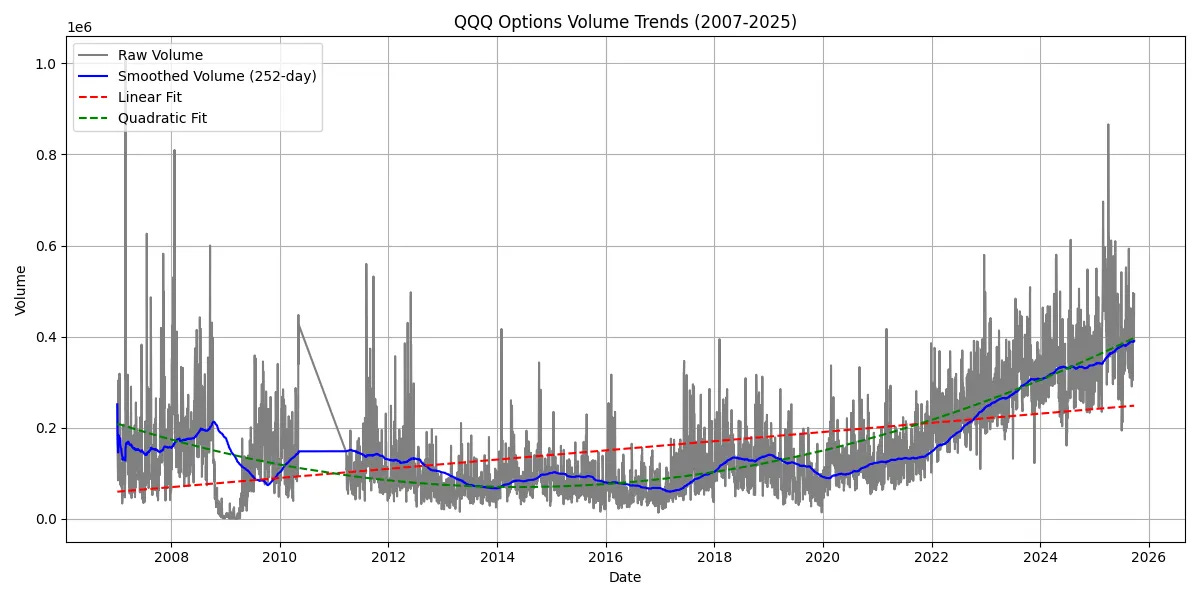
Firstly, things changed quite a bit after the GFC: regulations mandated dealers - banks and high frequency trading firms - to hold less stock on their books, so there’s a thinner buffer when orders surge. Most trades nowadays are algorithmically driven, and can widen or step back near instantaneously in response to changing risk levels. Many algorithms (like ETFs) or participants use similar signals and limits to make decisions, so when volatility jumps, they all cut risk together. That means less depth just as more orders hit, and price impact ramps up quickly rather than gradually.6Secondly, the generational wealth transfer from boomers to millennials and Gen Z creates rising liquidity (as portfolios are reshuffled) at just the time that retail trading is becoming massively accessible. Robinhood introduced options trading in December of 2017. You can see the influx of retail in the options volume data for the Nasdaq 100 from then onwards.7
The increasing returns to scale of winner-take-all markets means the big get bigger. I’m going to gloss over this a bit because it’s so spoken about, but AI actually has been and will the biggest driver of things getting extreme going forward precisely because it exacerbates this.
The top 10 biggest companies globally already have gone from 31% of the total market (in 2015) to 47% today. I’m sure you’ve seen those graphs showing companies with increasing speed to 100m+ users or increasingly few employees to $100m+ ARR. The kurtosis for startup successes is obscene. The outliers have kept getting bigger, now they’re doing so faster and more efficiently.

“Wait, but what has this got to do with venture?”
Rising vol-of-vol means wilder moves both negative and positive. Yavuzhan’s Optionality in venture funds does a good job unpacking the mathematics behind why you want to own options rather than equity in such an environment. I’d start there because it’s pretty important to see startups as call options for the rest of this piece.
There are several ways to harvest the extremity I’ve been talking about: you could long the market makers, you could long Brookfield as the value flows to alts, you could use options strategies or trend following, etc.
So why venture?
Maybe you’re thinking: “Jordan, if rising vol-of-vol means bigger negative tail risk, and if risk-on capital dries up during a big downturn, and if you can’t cut your losses in an illiquid environment, then surely venture would be a bloodbath in a downturn? Surely the main reason for increasing extremity is the money printing that has allowed for longer uninterrupted compounding and sharper power law distributions?”
If you are, good thoughts. I agree.
Venture’s not a hedge. If you want to hedge negative tail risk, buy puts or gold. But in a world of increasing extremity, how much do you want to be in private equity or highly priced public indexes? The inference from all the stuff above is that the world is getting more extreme. In such a world allocating to the “sure bet” is increasingly a worse idea. Fatter tails mean more returns come from the outliers (less from the median). You get to the tail by increasing the variance (or the scale) rather than raising the expectation.
Venture’s mechanics benefit from chaos. Most startups have some path dependant component to them, so you can think of tech as the shortest feedback loop on species-level evolution we have. Hundreds of thousands of founders are rapid-testing ideas on a range of markets, trying to adapt to a variety of conditions. When one adaptation works, it’s rapidly adopted (like those speed-to-100m-users graphs), disseminated (because we’re hyper-globalised) and we can build on top of it.8
Increased vol-of-vol means increased surface area for path dependant outcomes. Things compound faster, and yes the money printer has given us fatter tails and a bigger power law. Think of COVID pulling forward retail trading demand. Or the GFC for trustless money. Or bank runs (SVB) for stablecoin infrastructure. Or the transformer paper for app layer startups. Each of these represents a discontinuous shift where the “sure bet” incumbents were poorly positioned, and the variance (outliers) captured disproportionate value. These aren’t predictable trends but regime changes that invalidate previous assumptions and create winner-take-most dynamics for adapted solutions.
If I’m managing an endowment today, and I’m concerned about tail outcomes (either negative or positive), then one of the ways I’m thinking about venture is as part of a broader tail exposure strategy (perhaps moreso than as a basket of alts along with private equity). I’m hedging (puts, gold) for left tail and I’m exposing right tail with venture. In derivatives trading this is called a long straddle.
The catch is that you can’t index venture (Indexing Venture and Other Fools’ Errands). Venture is built to make money in disequilibrium. Most companies, funds, and vintages are bust, some are milli-baggers. A high loss ratio is a feature. It’s the exact opposite of Buffet being perfectly willing to trade away a big payoff for a certain payoff.
Yavuzhan and I have spent a lot of time thinking about manager selection in venture. We try distill this into our writing, I obviously write about it here, he writes about it over at Postcards from Istanbul. Hopefully it helps you in your venture allocating.
“How did the nobles become noble in the first place? They took it. At the point of a sword.” A Knight’s Tale, 2001
Many of these charts are dealing with composite indexes with a lot of underlyings, or they’re derived via options pricing, or they’re some weird basket blend. Often these baskets only have data going back a couple decades, not really a large enough sample for rigour. There’s very little literature on kurtosis, and that on volatility isn’t very helpful here (as it’s mostly dealing with the small scale volatility). I’m hoping someone reads this and decides it’s worth a more rigorous test.
For cross-referencing, both kurtosis and mean vol in oil and soybean prices hasn’t increased markedly over any recent timeframe, and both kurtosis and mean vol for gold has been declining since the early 2000s. Kurtosis for US treasuries has been declining since the 60’s, only the recent decades have seen the uptrend. Data hyperlinked.
Some papers argue commodity price volatility has increased since the early 1970s, particularly for groupings like food, beverages, and metals, driven by structural changes such as the collapse of Bretton Woods, exchange rate shifts, and oil shocks. Others claim no trend in commodity vol since the 1700s.
The seminal papers on individual stock volatility come from Campbell et al (2001, 2023). The first showed that “average idiosyncratic volatility increased relative to the volatility of a market index during the July 1962 to December 1997 sample period”. The second showed vol declining between 2001 and 2008, but rising from 2008 onwards across industry and market as well as individual stocks.
R^2=0.407
The Chinese CDS spread has been declining over the same timeframe.
At a firm level, a high debt-to-equity ratio means you don’t have a ton of wriggle room when things go bad and that you rip if things go well and you’re leveraged to the hilt. Looking at loan-level data (isolating out the other variables as best as possible) for large cap US stocks, the volatility-to-leverage elasticity has been around 20%: historically, your stock vol increases 2% for every 10% of debt you take. Since companies have been borrowing more over time, this could explain the rising individual stock volatility.
Publicly, debt as a percentage of GDP is nearing all time highs. Nearly half the world’s population lives under governments who spend more on interest payments than on healthcare or education. This is kind of okay so long as rates stay predictable, but sudden hikes would explode costs nonlinearly (which would explain the rising CDS spreads).
The valuation god himself opined recently that stocks were in fact, richly priced, but that it’s kinda moot to say so because there’s nowhere else really to put your money. The total-market-cap-to-GDP ratio is at all time highs (and nearly double the 20 year average), the S&P 500 CAPE ratio is in the 94th percentile and the implied equity risk premium is near 0%.
Network theory is well covered mathematically, empirically, theoretically, and narrative-wise. While it’s harder to directly tie the upside to the network (as there’s no counterfactual), doesn’t mean it’s not there. Amazon, Shopify, and MercardoLibre wouldn’t exist today without the same logistics density we shipped the vaccines with.
As interconnectedness pertains to market vol:
In Search of the Origins of Financial Fluctuations: The Inelastic Markets Hypothesis by Xavier Gabaix and Ralph S.J. Koijen (2022)
Leverage Causes Fat Tails and Clustered Volatility by Stefan Thurner, J. Doyne Farmer and John Geanakoplos (2011)
Does Climate Risk Amplify Oil Market Volatility? by Kazeem Isah, Adedapo Odebode, Oluwafemi Ogunjemilua (2023)
Realized correlations, betas and volatility spillover in the agricultural commodity market: What has changed? by Matteo Bonato (2019)
Dynamic linkages and determinants of sovereign CDS and exchange rates: evidence from G7 and BRICS by Min Su, Yixuan Ren, Yifang Niu & Zhen Wang (2025)
How has the relationship between major financial markets changed during the Russia–Ukraine conflict? by Ping Li, Peiyao Zhang, Yanhong Guo & Jiahong Li (2024)
Boomers - who’ve experienced maybe the best 50+ year stock market run in history over their lives - will transfer around $105 trillion to heirs while $18 trillion will go to charity through 2048. One implication of this for us is to expect a swell in interest for alts (crypto, venture, private equity) as younger family office principals on average have a 3x higher allocation here than their parents. Given increased liquidity alone has a causal relationship with the propensity to boom and bust, the reshuffling here alone adds fuel to the fire.
I expect options and leveraged products to only grow in appeal as more asset-poor folk feel their opportunity whizzing by as the rich get richer and assets get further and further out of reach. Jez has a great post on being long degeneracy, “a belief” in his words “that that the world will only get more degenerate, financialized, speculative, lonely, tribal and weird.”
My hunch is that this whole rising kurtosis idea would also imply continued outperformance of the momentum factor over value. Does anyone know if this has been the case historically?